Project Info
- Construction Date: September 1997
- Location: Philadelphia, PA
- Category: Case Studies & Pilot Projects
Project Details
The objective of this study was to measure the existing line losses on a 40-year-old section of the underground steam distribution systems in Philadelphia and compare them to the line loss data recorded after the application of the re-insulation process.
More Project Details
EFFECTS OF REINSULATING UNDERGROUND STEAM PIPES
Tim Mentzer, Vice President Trigen-Philadelphia Energy Corporation, Philadelphia, Pennsylvania
ABSTRACT
District heating and steam distribution through an underground network of pipes dates back to the late 1800s. Many systems exist today with piping networks that exceed 50 years of service life. The age of these systems has taken its toll resulting in the thermal inefficiency of the network. The Department of Energy (DOE) estimates there are 20,000 miles of heat distribution pipes. Millions of dollars a year are lost due to the ineffective thermal efficiency of these pipes. This inefficiency contributes to excess fuel burned at the plant, resulting in excess emissions that contribute to global warming.
Steam distribution networks exist in major metropolitan areas, military bases and university campuses. The costs to replace these systems due to poor thermal efficiency would cost billions of dollars. In most cases, the steel carrier pipe is still in good condition and the outer conduit is intact; however, the insulation surrounding this pipe has degraded or fallen off and washed away.
The objective of our group was to develop a way to re-insulate buried underground networks and provide a cost-effective alternative to replacement. The case study being presented indicates that ConduFill is a viable solution for many applications
BACKGROUND
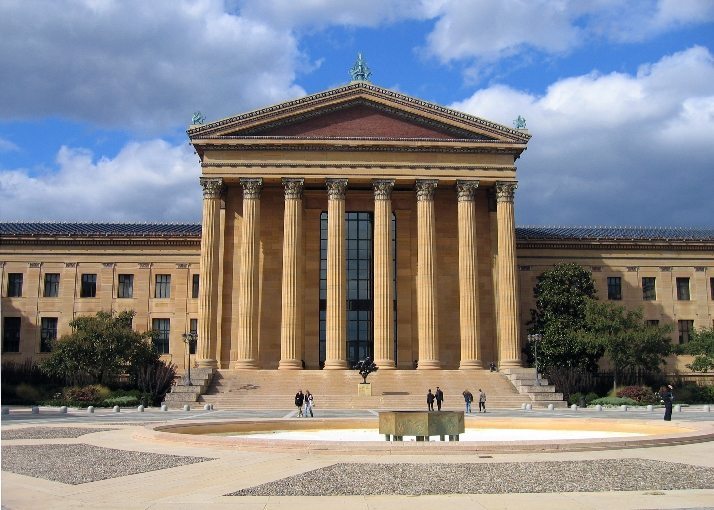
In 1995 Trigen Energy Corporation of White Plains, NY and Power Component Systems of Hanover, MD began by researching two main elements to implement this project. First, we had to develop a means for accessing buried steam piping networks to install an insulation product, and second, the insulation product had to be pumpable, flowable and be able to withstand up to 400°F. Our experience with these systems is that the majority of them distribute steam at less than 200 psi and the 400°F temperature would be the upper limit the insulation product would have to withstand, if no existing insulation were in place on the pipe. In most cases we have found some remaining insulation on the pipes and our interface temperatures have been much less than 400°F. After several years of research, development and field testing, a field test site was set up in Philadelphia in January 1997 to monitor the performance of a section of the underground network before and after it was re-insulated. The branch line chosen services the Philadelphia Museum of Art.
OBJECTIVE
The objective was to measure the existing line losses on a 40-year-old section of the network and compare them to the line loss data recorded after the application of the re-insulation process. The term line losses, as used in our industry, refers to the difference between the amount of steam sent out from the plant and the total of all steam sold. Steam is metered out of the plant and all customers’ usage is metered. Line losses include, in addition to thermal losses, leaks that may be in the system, the steam required to operate steam traps throughout the system, and the steam that may go unmetered to the customer. The line was re-insulated in September 1997 providing 8 months of pre-insulated data. The expectation was to see a reduction in line losses of about 40% annualized, based on the theoretical improved thermal performance of the re-insulating material. Additionally, data collected in the spring of 1997 indicated a tremendous increase in line losses due to the effects of ground water intrusion after heavy rains. We anticipated seeing a reduction of these effects also.
DESCRIPTION
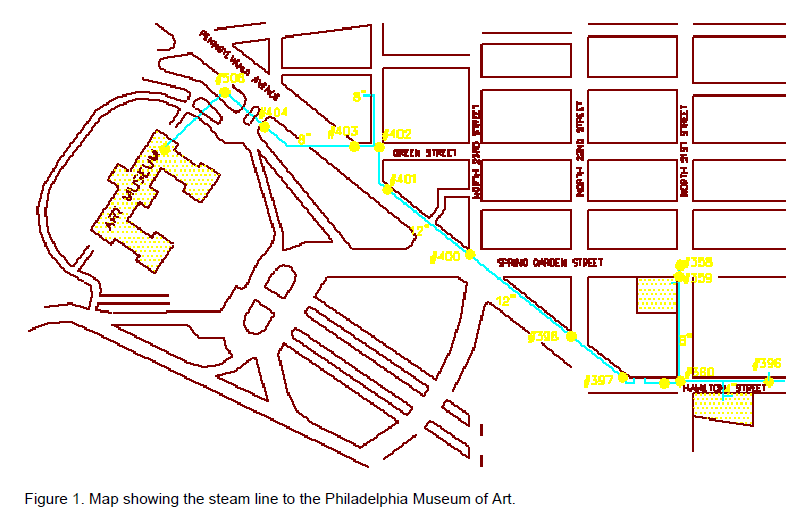
The Philadelphia Museum of Art is the only customer at the end of a 2500-foot branch line on Pennsylvania Avenue. The map shows the configuration of the 12″ and 8″ diameter piping. There are six steam vaults between the two-meter locations. These vaults contain expansion joints and low point trap stations. The piping and equipment in the vaults is insulated, and all vaults were inspected and maintained to ensure there were no leaks. For the purpose of the study, it would be assumed that the steam lost due to the operation of the six low point traps would be consistent before and after the re-insulation. The underground steam line is a combination 12″ and 8″ diameter piping that did not have severely deteriorated insulation on it. The existing insulation was 2″ of mineral wool and the conduit was a transite pipe. The existing conduit provided a 1-1/2″ air space that was the target void to be filled by reinsulation. It was assumed that we would get as much as 2″ of the insulation product into the void because the mineral wool would compress during the installation process.
FLOW MEASUREMENT
The most accurate means to measure the line losses along the line was to measure the steam flow into the branch and compare it to the steam flow delivered at the building. In order to accomplish this, a meter vault was constructed at the beginning of the branch line on Hamilton Street. A Johnson Yokogawa vortex meter existed in the Art Museum. We have found this to be one of the more dependable and accurate steam meters. The Philadelphia system has had over 150 of these meters in service for several years. An identical meter was installed in the new meter vault.
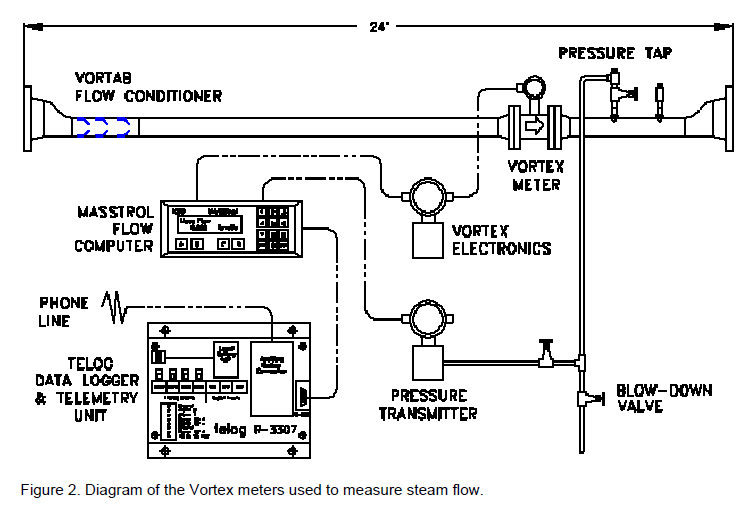
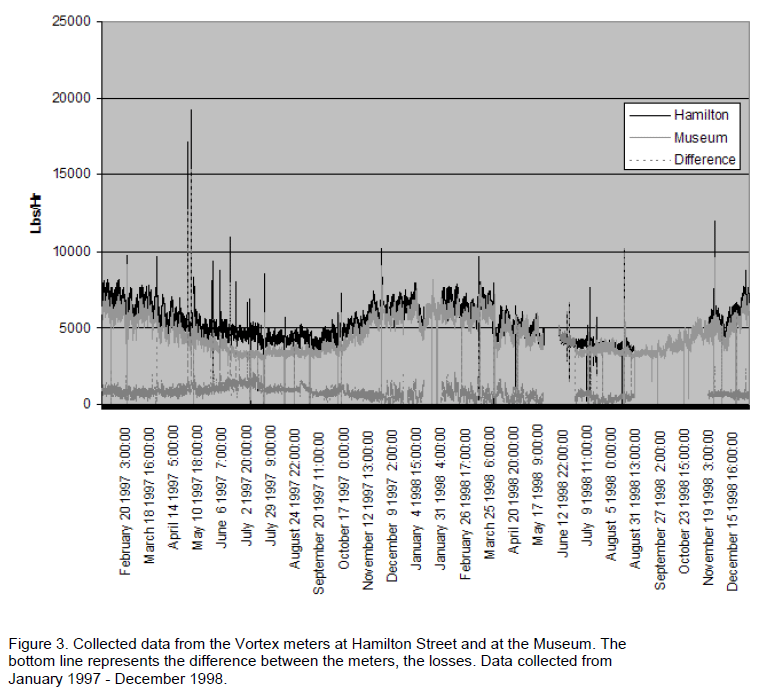
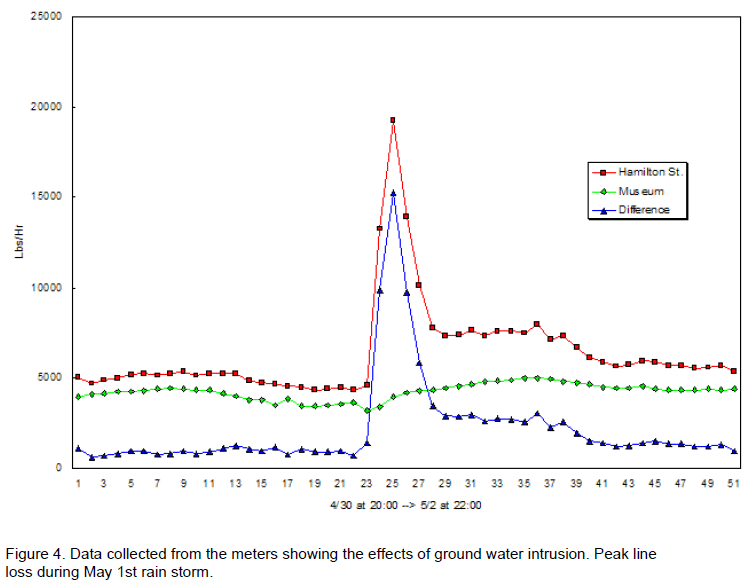
The metering system in the new meter vault consisted of a 6″ Johnson Yokogawa vortex meter, Yokogawa DPHarp pressure transmitter, a KEP Masstrol flow computer, a Telog data logging system and a UPS system. Electrical service was installed in the vault. The system collects steam flow inputs several times per second, pressure compensates those values every 5 seconds, and averages and logs the data every 15 minutes. The attached graph depicts these values for both the meter vault location and the Art Museum location. Beginning in January 1997, both meters were synchronized to begin simultaneously measuring the average flow rate at each location for the purpose of determining the line losses between the meters over the 2500-feet by taking the difference of their readings. Monthly data was logged and stored for analysis in Excel.
EFFECTS OF GROUND WATER INTRUSION
Another phenomenon we were analyzing was the effect of ground water intrusion into the steam conduit after heavy rains. As can be seen on the attached graph, on May 1, 1997, we experienced a significant spring rainfall of more than one inch within a 24-hour period. The line losses increased from approximately 1000 lbs/hr to 15,000 lbs/hr as a result of the ground water intrusion getting the mineral wool insulation wet. During this same time period the museum’s steam load remained at about 4,500 lbs/hr. It took about 48 hours for the conditions to return to normal. This event resulted in an additional waste of approximately 61,000 pounds of steam over the duration to dry out the insulation and return to normal. This data indicated the additional value of re-insulating with a material that would fill the annular air space, seal conduit breaches and prevent ground water intrusion into the conduit.
CONDUFILL- RE-INSULATION PROCESS
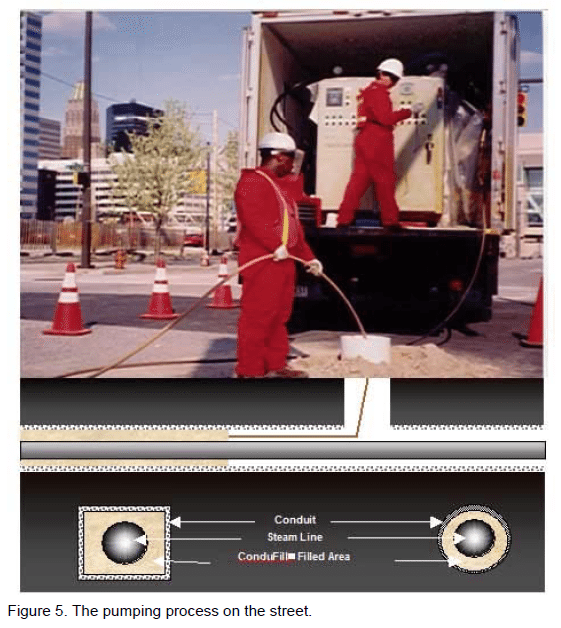
The re-insulation process begins with an engineering evaluation of the section of steam conduit to be re-insulated. Depending on the type of system, access points are determined for optimal application. Access points can be up to 100 feet apart. In this case they averaged about 60 feet due to the limited annular space of about 1 1/2 inches. Vacuum excavations access the buried conduit system. The vacuum excavations are approximately 18 inches in diameter. Then a 12 inch PVC tube is installed down to the top of the conduit. The 12 inch tube permits access by the drilling equipment that drills through the top of the conduit. The drilled access through the conduit is about 3 inches in diameter. High-temperature tubing is then inserted through the conduit in both directions. These tubes provide the means for dispensing the insulation materials. The custom designed, self-sufficient, mobile pumping unit dispenses the insulation material within the precise technical parameters required. The injected liquid chemicals react to form a high density, closed cell foam that expands 30 times in volume to ensure complete coverage around the pipe. Any existing cracks in the original conduit are also filled and sealed to prevent water intrusion based on the nature of the expanding foam. The foam has an excellent K value of 0.18 BTU-inch/hr-ft2-degree F. After the process is completed, the access excavations are backfilled and the area is restored. The entire process took about 3 weeks to complete.
FINDINGS
Line Losses The following table shows the monthly average steam flow rates in pounds per hour for each of the meters since January 1997. For September and October 1998, electric power was lost to the Hamilton Street meter and data was lost. Comparing January to September for 1997 and 1998, there was a 44.1% reduction in line losses. This was the before and after re-insulation period. February 1998 experienced an event in the street where a section of the buried
conduit and insulation was damaged that affected the results. Effects of Precipitation For the seven months prior to re-insulating, we created graphs of the data and superimposed precipitation events as recorded by the National Oceanic and Atmospheric Administration (NOAA).
During this period, there were 51 events greater than a trace (>0.01″). Of these 51 events, 42 had no effect on line losses, and 9 did have an immediate effect of increased line losses for a short duration. Of the 9 precipitation events that had an effect on line losses: · 13% of the precipitation events between 0.01″ and 0.05″ had an adverse effect · 10% of the precipitation events between 0.05″ and 0.10″ had an adverse effect · 20% of the precipitation events between 0.10″ and 0.15″ had an adverse effect · 0% of the precipitation events between 0.15″ and 2.0″ had an adverse effect · 36% of the precipitation events >0.20″ had an adverse effect
There is no correlation between the amount of precipitation and whether or not it effected line losses, nor was there a correlation for time of the year except that all four events in June resulted in an increase in line losses. The increase in condensate due to the precipitation for the 9 events was 197,380 pounds. For the time period after the re-insulation, September 1997 to April 1999, there have been no events of an increase in line losses due to precipitation events. During this period there have been approximately 100 precipitation events. The total precipitation for this area in 1997 was 32.25 inches and for 1998 it was 31.88 inches. The continuing comparison is to evaluate the effectiveness of the thermal properties as the system ages. The expectation is to see very little difference between comparative months. This would indicate the continued integrity of the re-insulated system.
CONCLUSION
The comparison of the eight months of before and after re-insulation data indicates a 44.1% reduction in thermal line losses. The month to month average hourly steam flow rate for the Art Museum is very similar. They have a consistent steam load which provides a good comparison. The largest percentage reductions were during the summer when the museum’s steam load is the lowest. This was expected since these months were previously the highest months for line losses. The range of monthly average line losses dropped from 745-1312 lbs/hr (Jan-Sep 1997) to 234-745 lbs/hr (Jan-Sep 1998), disregarding February 1998.
The comparison of the line losses due to the effects of precipitation indicates that water intrusion has been minimized since the re-insulation. There were obvious indications in the data that some precipitation events were causing an immediate increase in line losses. For the 18 months since the re-insulation, there have not been any such indications. The detailed level of the field data collected and the
corresponding results provides us with a high level of confidence that the re-insulation process is performing as expected.